Overview
When you click on any document from the Reports dashboard, you are taken to a detailed analytics page for that specific document. This gives you a deep view into how recipients are engaging with that document including session-level data, reading patterns, version performance, and AI-powered insights.
Accessing Document Analytics
Go to Reports in the left sidebar
Scroll down to the Documents table
Click on any document to open its detailed report
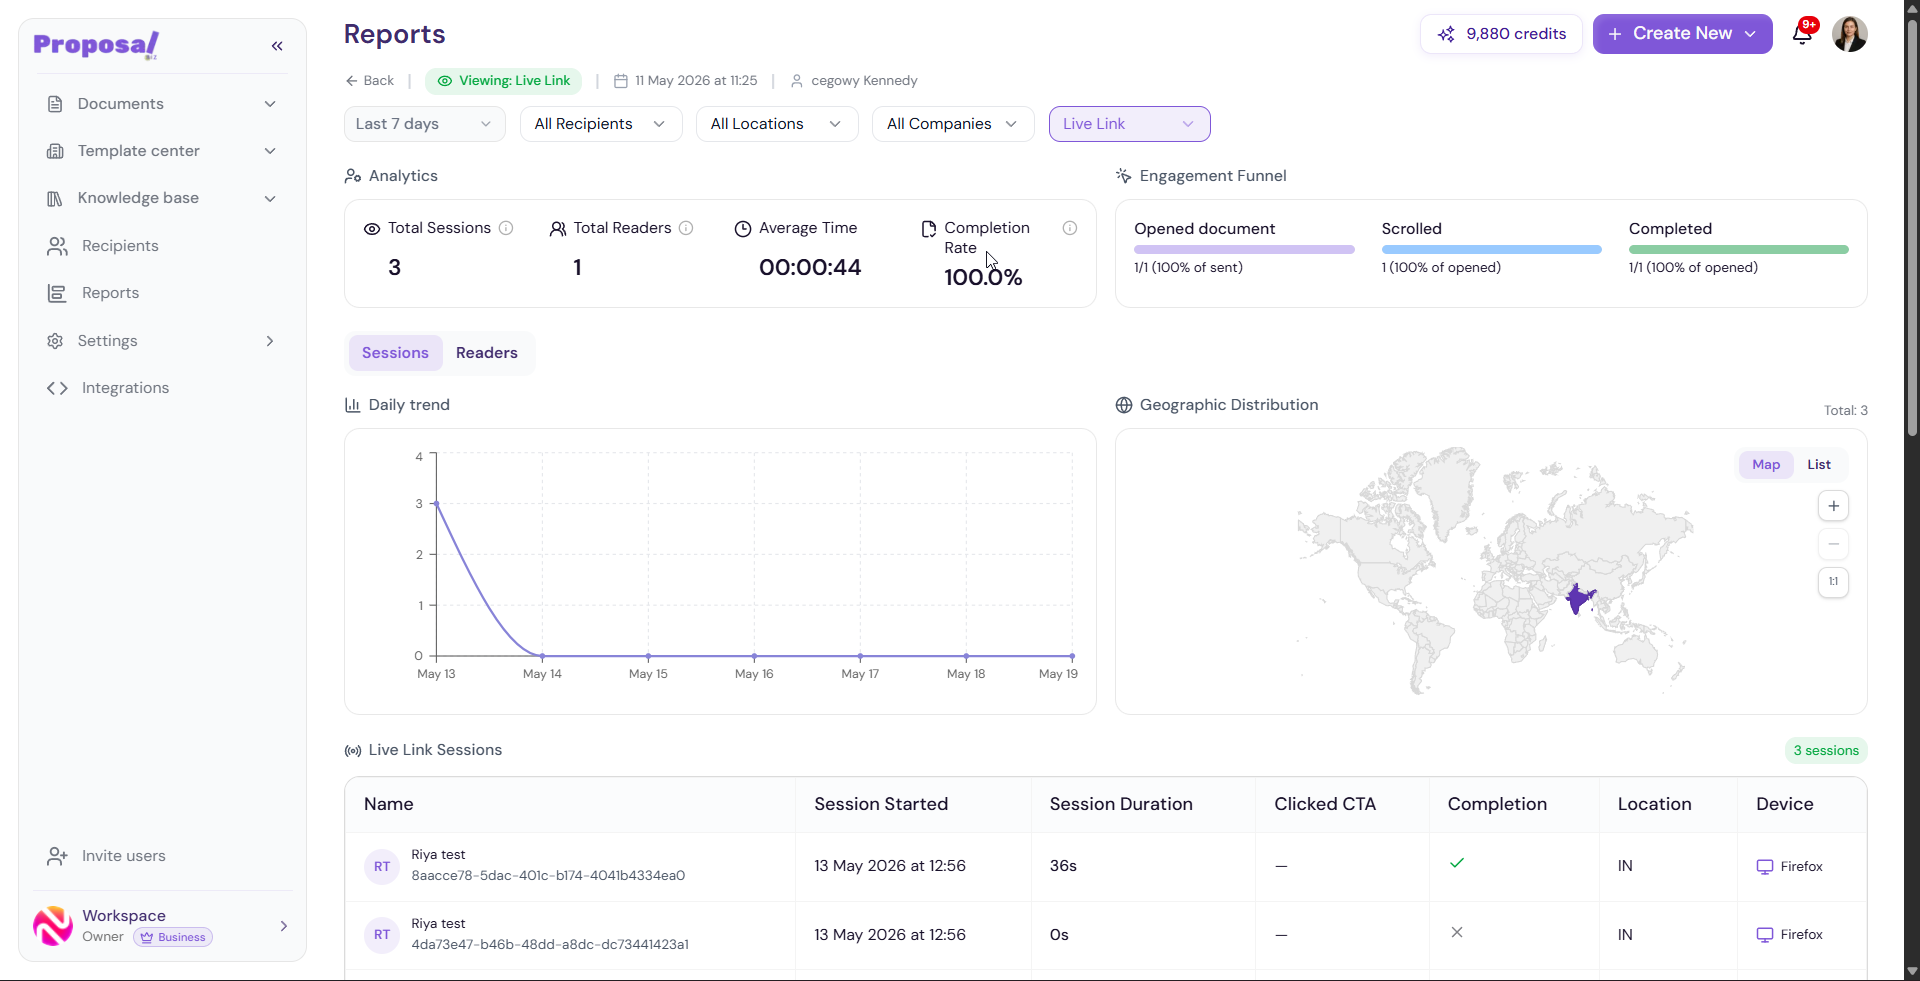
Document Report Header
At the top of the document report you will see:
A Back button to return to the main Reports dashboard
Viewing status — Shows the link type being viewed (e.g. Live Link)
Date created — When the document was created
Recipient name — Who the document was shared with
Filtering Document Analytics
You can filter the document analytics using the following options:
Date range — Last 7 days, Last 12 months, or a custom range
All Recipients — Filter by a specific recipient
All Locations — Filter by geographic location
All Companies — Filter by company
Link type — Filter by Live Link or other link types
Reset — Clear all applied filters
Analytics Summary
The same four key metrics are displayed at the document level:
Total Sessions — Total number of viewing sessions for this document
Total Readers — Number of unique readers
Average Time — Average time readers spent on this document
Completion Rate — Percentage of readers who completed the document
Engagement Funnel
The Engagement Funnel shows the progression of readers through this specific document:
Opened document — Number and percentage of recipients who opened out of total sent
Scrolled — Number and percentage of openers who scrolled through the document
Completed — Number and percentage of openers who completed the document
Sessions and Readers Tabs
Switch between two views to analyse the document activity:
Sessions — Daily trend of total sessions over time
Readers — Daily trend of unique readers over time
Daily Trend
A line chart showing the daily trend of sessions or readers for this document over the selected date range. Hover over any point to see the exact date and session count.
Geographic Distribution
See where your readers are located for this specific document. Toggle between:
Map — World map with highlighted regions
List — Country-level breakdown with sessions and percentage
Note If no readers have viewed the document yet, this section will display "No geographic data available yet. Country insights will appear once visitors start viewing your projects."
Live Link Sessions
The Live Link Sessions table shows every individual session for this document with the following details:
Name — Reader's name or identifier
Session Started — Date and time the session began
Session Duration — How long the reader spent viewing the document
Clicked CTA — Whether the reader clicked any call-to-action in the document
Completion — Whether the reader completed the document
Location — Geographic location of the reader
-
Device — Device and browser used to view the document
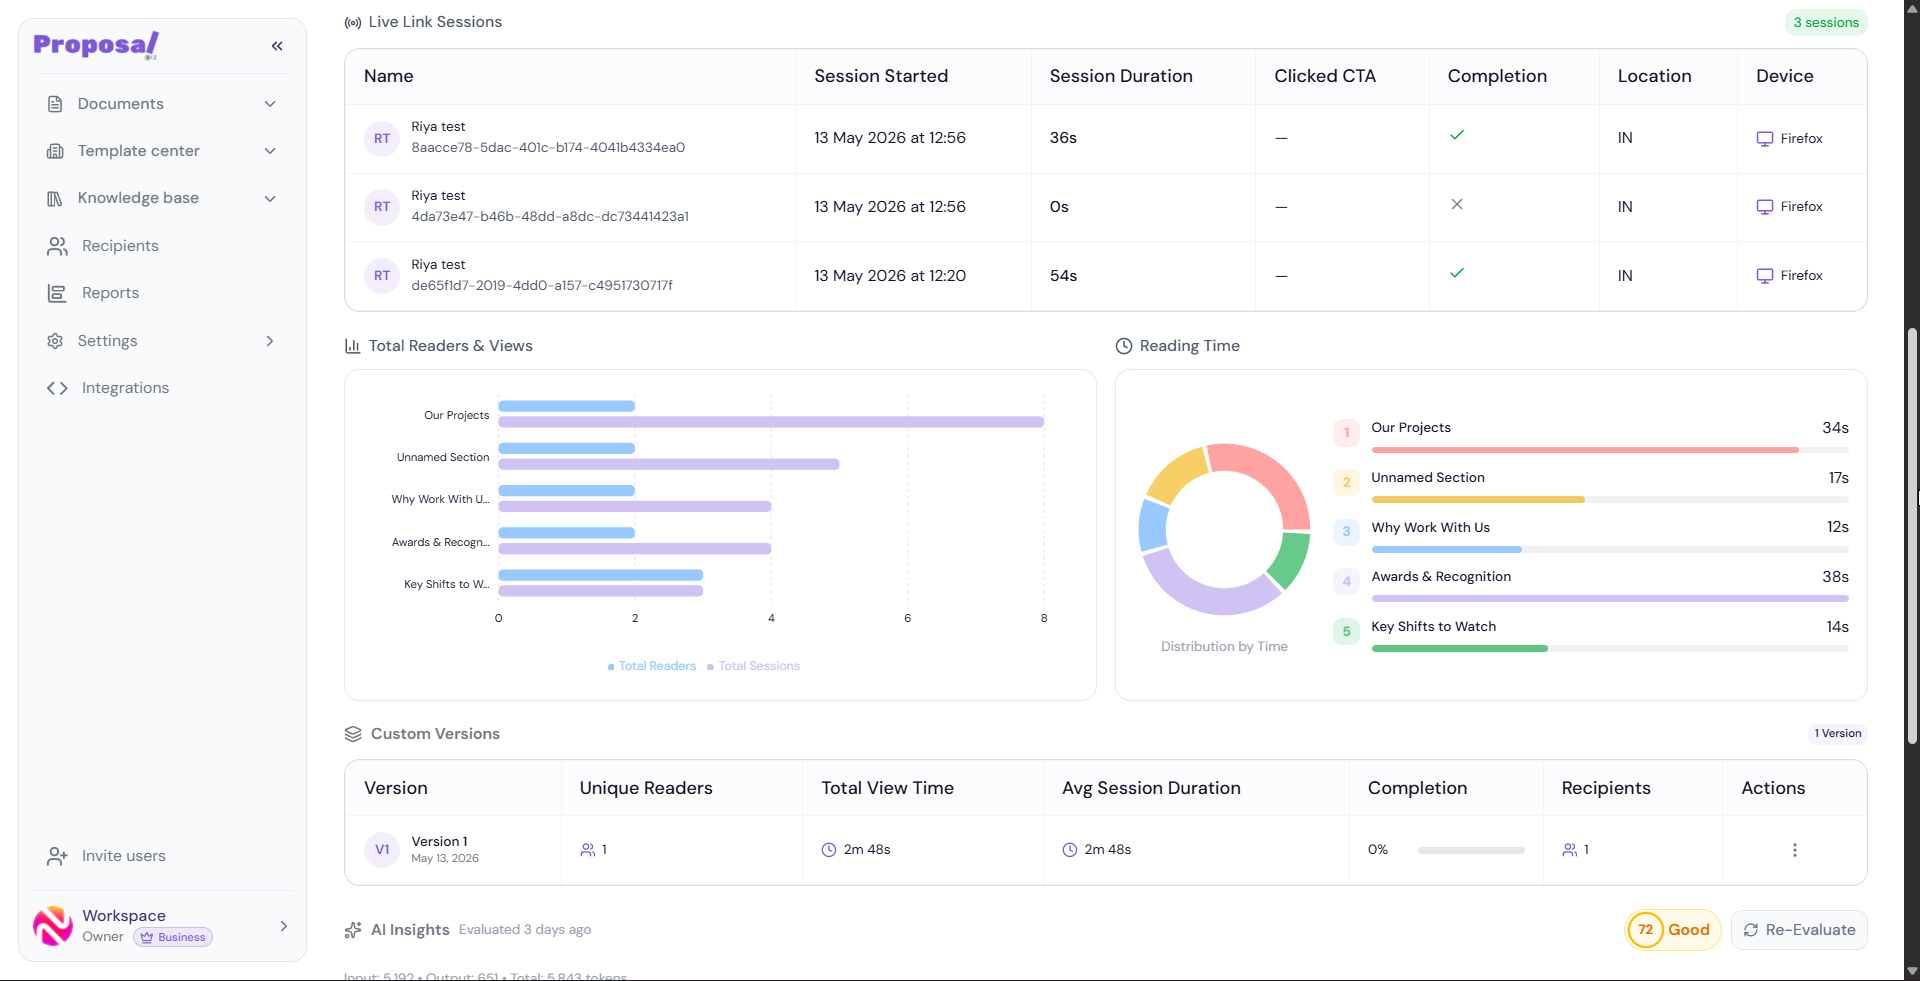
Total Readers & Views
A horizontal bar chart showing total readers and total sessions broken down by section. This helps you understand which sections of your document are getting the most attention.
Reading Time
The Reading Time section shows a donut chart visualizing how much time readers spend on each section of your document. Each section is displayed with its name and the time spent reading it.
This helps you identify which parts of your document hold attention and which are being skipped.
Custom Versions
If you have multiple versions of the same document, the Custom Versions section lets you compare their performance side by side:
Version — Version number and date
Unique Readers — Number of unique readers for this version
Total View Time — Total time spent viewing this version
Avg Session Duration — Average time per session
Completion — Completion rate for this version
Recipients — Number of recipients for this version
Actions — Additional options for managing the version
Click View details on any version to see its detailed session-level data.
💡 Pro Tip Use Custom Versions to A/B test different document structures or content approaches. Compare completion rates and reading times across versions to understand which format performs best with your recipients.
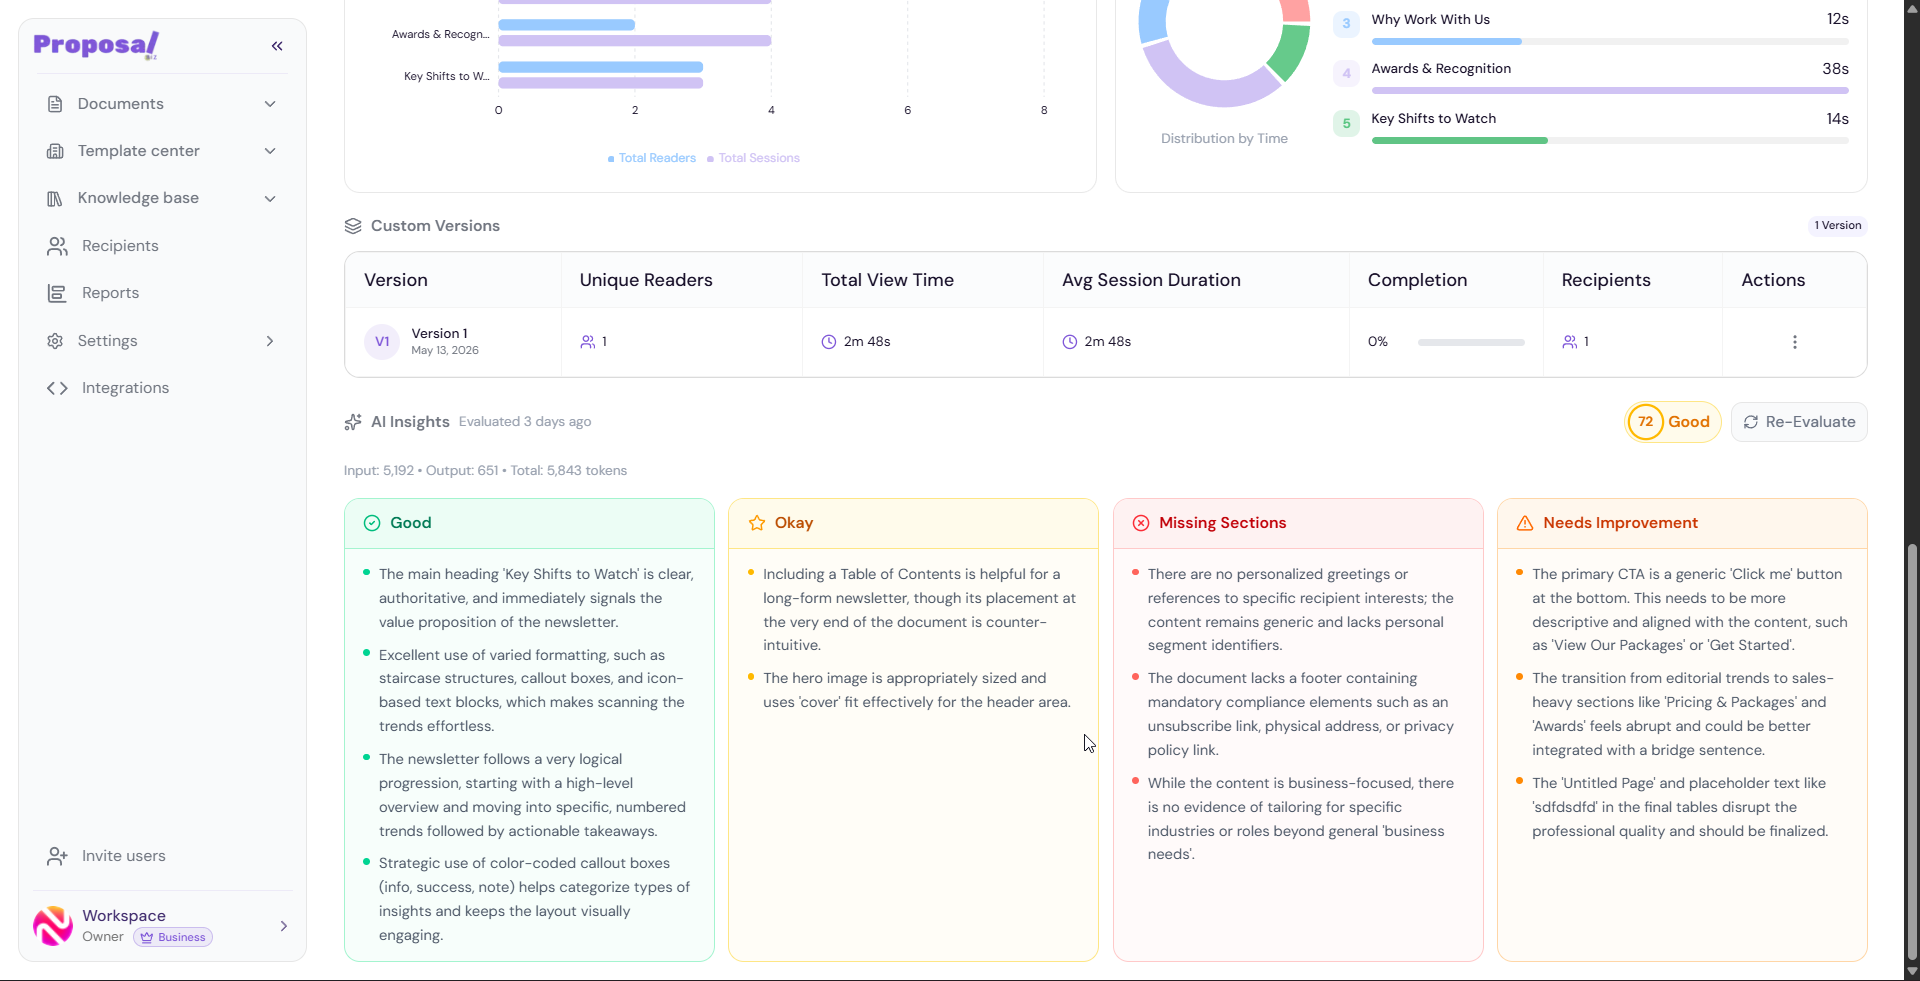
AI Insights
At the bottom of the document report, the AI Insights section provides an AI-powered evaluation of your document. It is organized into four categories:
Good — Strengths of your document that are working well
Okay — Areas that are acceptable but could be improved
Missing Sections — Content areas that your document is lacking
Needs Improvement — Specific areas that need attention
Each category contains detailed bullet points explaining what the AI found.
An overall AI Score is displayed alongside a label such as Fair, Good, or Excellent. You can click Re-Evaluate at any time to refresh the insights based on the latest version of your document.
💡 Pro Tip Run the AI evaluation before sending your document to a recipient. The Missing Sections and Needs Improvement categories often highlight gaps that could make the difference between a document that gets signed and one that gets ignored.